“Without data, you’re just another person with an opinion” – W. Edwards Deming
Several years later, this quote still holds true. However, today the problem isn’t about collecting data as much as it is about communicating and presenting it effectively.
Graphs are one such visual you can use to tell a good data story. They can be used to:
- Convey a specific data point
- Compare independent values or parts of a composition
- Demonstrate changes over time
- Show correlations or reveal relationships
Let’s face it: creating graphs on Excel isn’t the best option. Not only is it a tedious process but the outcome isn’t aesthetically pleasing either.
Wondering how to create graphs that are visually appealing and functional? This is where graph makers come into the picture.
Here are the six best graph makers you can use to create beautiful graphs for free.
1. Venngage
Table of Contents
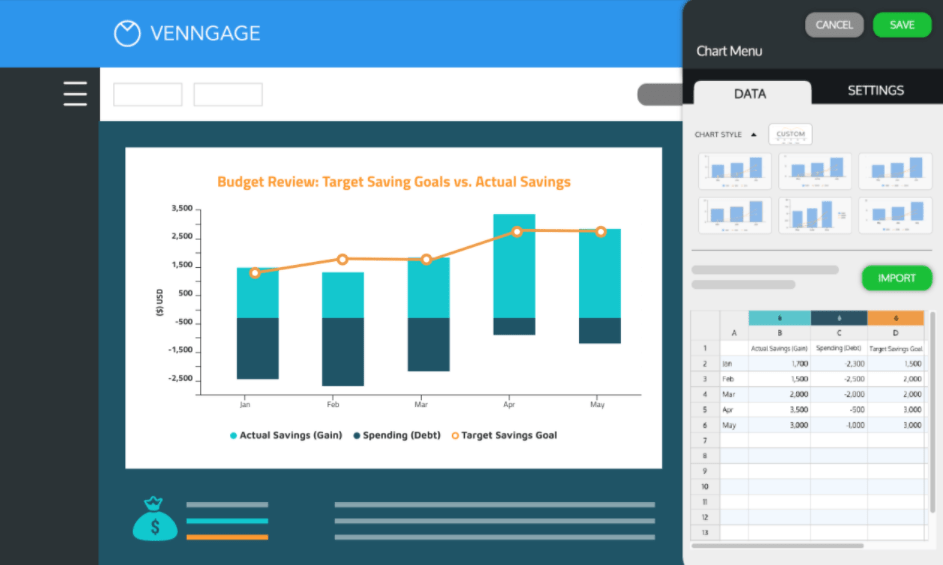

From internal reports and presentations to blog posts and infographics — Venngage’s graph maker helps you create stunning graphs for a range of purposes.
They have a variety of modern, easy-to-edit templates for pie charts, bar graphs, line graphs, area graphs, scatter plots and more.
Whether you’re looking for clean and conservative designs or bold and creative ones, there are over 100 different graph templates that you can choose from.
All you have to do is pick the right template, enter your data, and customize the design by experimenting with icons, illustrations, colors, logos, and fonts.
Worried about dealing with heaps of data? Don’t be. Venngage’s online graph maker tool lets you upload an Excel file or paste your Google Sheets link, making it incredibly easy to import data into the tool.
That’s not all, you can also collaborate with your team in real-time by adding team members, sharing templates, and leaving comments.
2. Adobe Spark
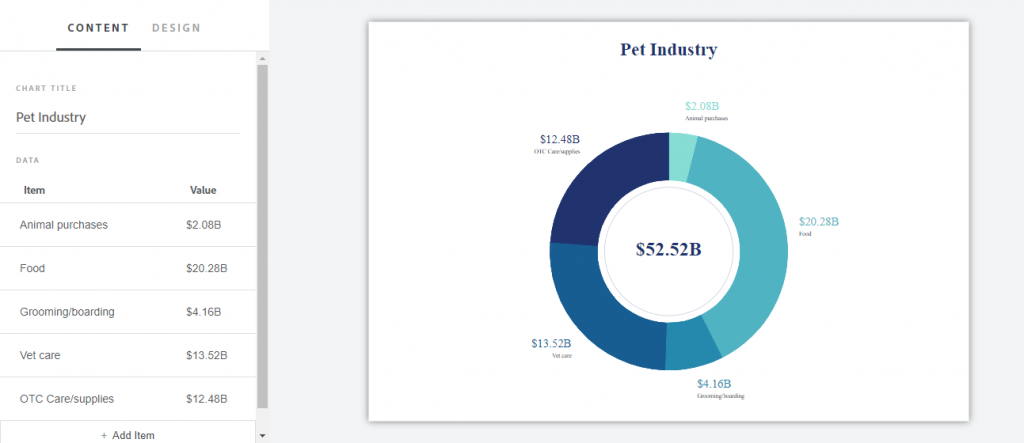

Unlike other Adobe products, Adobe Spark is specifically created for non-designers.
Their free graph maker tool lets you design pie charts, donut charts, line graphs, and bar graphs for your personal and professional projects.
You can use the drag-and-drop interface to add data points and categories. They also have different color schemes and layouts to help you create unique graphs.
Once you’re done, you can download the graph to use elsewhere, print it, or share it on social media.
3. ChartBlocks
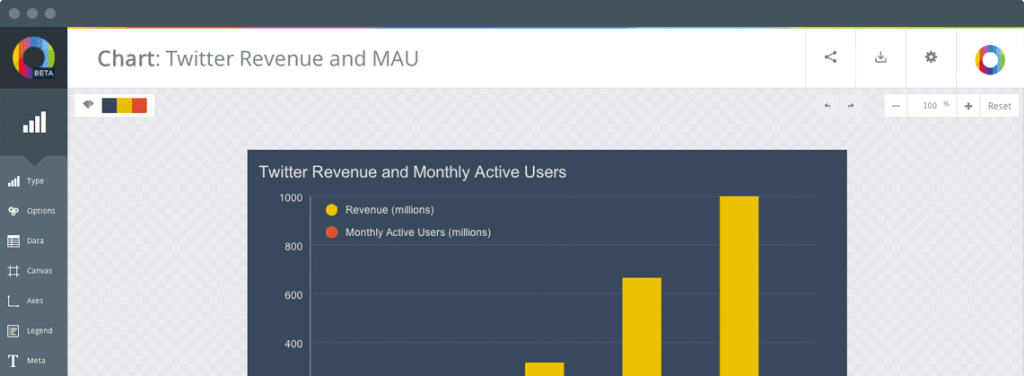

ChartBlocks is another easy-to-use online graph maker.
You can create a graph in minutes by manually entering the data or pulling it from spreadsheets, data management tools, and even live feeds. From colors to layouts and sizes, you can customize every aspect of these graphs.
ChartBlocks graphs are hosted with D3.js which means you get to create responsive charts for a range of devices and screen sizes.
Their ‘Personal’ plan is free. It lets you create and export up to 50 active charts.
The downside is that these charts are branded with the ChartBlocks logo. If you want to remove their branding, you will need to upgrade to their ‘Professonal’ plan which is $20 per month.
4. LiveGap
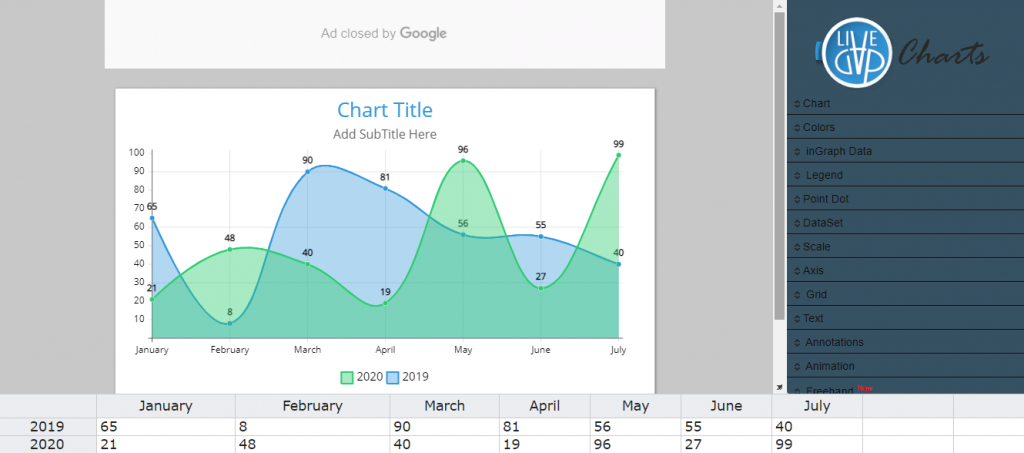

LiveGap is a popular choice among teachers and students. This graph maker lets you create professional-looking graphs such as pie charts, doughnut charts, radar charts, polar charts, area graphs and more.
You can either manually enter the data into the tool or paste it from an excel sheet. You also get to customize design elements such as the color, font types, sizes, borders, legends, and axes.
After you’ve created the graph, you can choose to save it as an image, an animated web page, or share it as a link with other people.
5. Plotvar
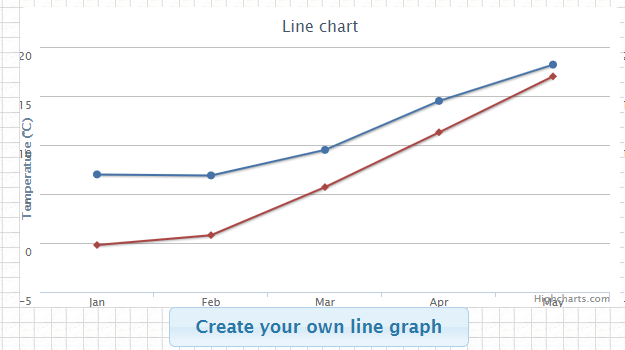

A simple yet effective graph maker, Plotvar helps you create line graphs, pie charts, bar graphs, and live graphs within minutes.
You just have to choose the graph type, fill the data input form, and you’ll be presented with a link that can be shared with people.
Plotvar is designed to be “fast and easy to use” and is only free for non-commercial use.
6. RAWGraphs
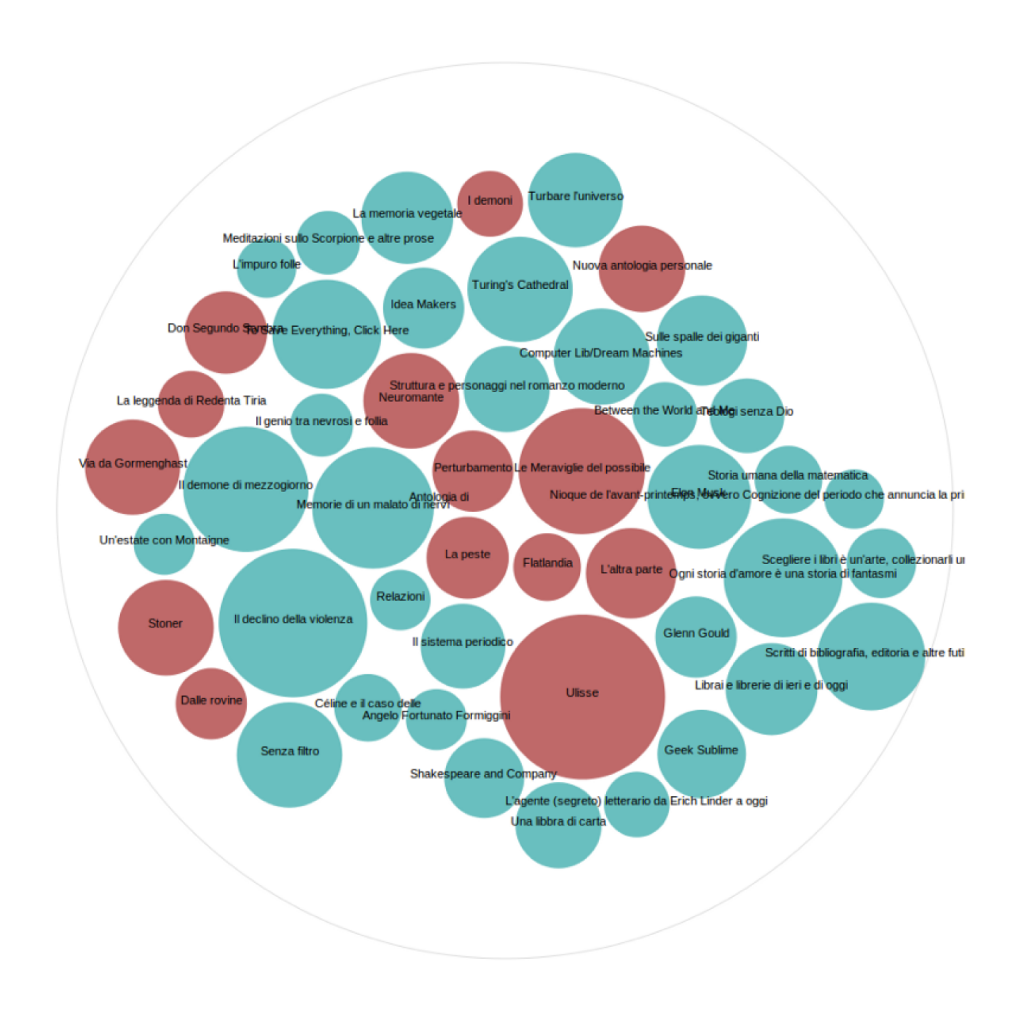

RAWGraphs aims to be the “missing link between spreadsheets and data visualization”.
Unlike the other graph makers, this one is developed keeping designers and developers in mind. While they have a range of graph templates, you can also create your own graphs from scratch, for free.
RawGraphs lets you export visualizations as vector (SVG) or raster (PNG) images to embed into your web page.
The takeaway: create beautiful graphs for free
A well-designed graph that communicates data effectively is impactful, and there’s so much more to it than just plotting numbers.
So, stop relying on Excel. Designer or not, these six online graph makers will help you create beautiful and functional graphs for free, within minutes.
Photo by Isaac Smith on Unsplash


