GraphQL is a popular, powerful query tool for APIs. It provides developers with an efficient and flexible way to access and manipulate data in our databases.
With its increasing popularity, many developers are seeking new ways to better understand and visualize their GraphQL data. There are a number of visualization tools that satisfy this need efficiently.
In this article, we will discuss using GraphQL Voyager, GraphiQL, and Altair for data visualization, exploring how you can use these tools to enhance your workflow and gain deeper insights into your data. We will cover:
Use cases for GraphQL data visualizers
Table of Contents
- 1 Use cases for GraphQL data visualizers
- 2 Exploring data with GraphQL Voyager
- 3 GraphQL Voyager caveats to consider
- 4 Using powerful GraphiQL features to construct queries
- 5 Important considerations while using GraphiQL
- 6 Using GraphQL Altair to work with APIs
- 7 Considerations to keep in mind for GraphQL Altair
- 8 Conclusion
GraphQL data visualizers are useful tools for various scenarios, including:
- Debugging GraphQL APIs
- Collaborating with teams
- Optimizing performance
- Understanding API dependencies
- Testing GraphQL APIs
Let’s explore each of these use cases in more detail now.
GraphQL data visualizers can help developers debug their GraphQL APIs by giving them visual representations of the data they fetch from their servers. These data visualization tools show you how your queries work and which data they call so you can easily identify any mistakes or errors in your query.
You can also use GraphQL data visualizers to highlight performance issues in your queries and show you how you can optimize said queries. With GraphQL data visualization tools, it’s easy to debug your APIs and ensure that your app works as expected.
In a team setting, different members bring various skills from different areas of focus. A GraphQL data visualizer can help team members communicate better and leverage the team’s collective expertise more efficiently by allowing them to visualize the API and its components.
By visualizing a GraphQL API, developers can identify performance bottlenecks and inefficiencies in query execution. They can then optimize queries to improve response times and overall application performance.
In complex systems with multiple APIs and microservices, a GraphQL visualizer can help developers visualize dependencies between different services, making it easier to identify and resolve issues or bottlenecks.
Data visualization tools also help in testing GraphQL Apis by providing a good view of expected responses and identifying issues with queries.
Exploring data with GraphQL Voyager
One of the most popular and open source data visualization tools for GraphQL is GraphQL Voyager.
GraphQL Voyager provides an interactive visual representation of your GraphQL schema and allows you to look through your API by visually browsing its object types, fields, and relationships.
With its simple and user-friendly interface, you can zoom into and out of your schema easily, search for particular fields, and see data types.
GraphQL Voyager demo
GraphQL Voyager works by parsing a GraphQL schema and generating a visual representation of its types and fields.
The tool uses the GraphQL introspection query to obtain the schema, making it compatible with any GraphQL server that supports this query. Once the schema is obtained, GraphQL Voyager generates the interactive graph that visualizes the schema.
Let’s explore an example of GraphQL Voyager in action.
Navigate to the live demo of GraphQL Voyager on GitHub to see APIs represented as interactive graphs. For this example, we’ll analyze the Star Wars API.
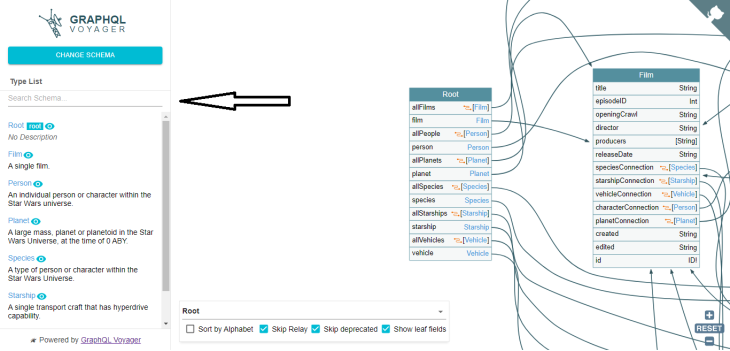
Click on the “Change Schema” button on the top left side of the screen and select Star Wars:
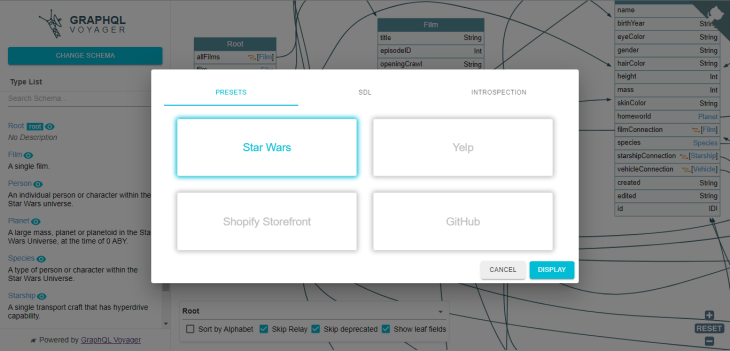
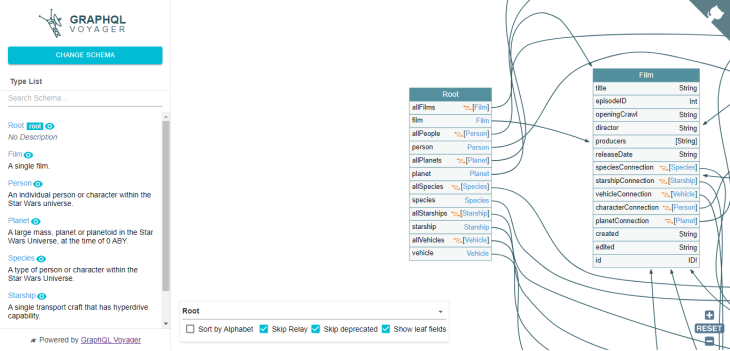
You’ll see a graphical representation of the schema in the center of the screen. Familiarize yourself with the interface.
The pane on the left side of the screen lists all the object types in the Star Wars schema. The pane on the right side of the screen shows information about the currently selected type or field.
This schema is based on the Star Wars universe and includes object types for characters, films, planets, and other entities from the Star Wars saga. Each type is depicted as a node in the graph.
You can click on a node to view the type details, which include the type name, description, and the fields it contains. The lines you see on the interface represent the relationships between different types and fields in the schema.
In GraphQL, types are connected to each other through their fields, and these connections are represented as edges in the visualization. The edges are directed, meaning that they point from the type that declares the field to the type that the field returns:
Select a type to explore
To explore a type in your schema, you can click on its name in the left pane. This will highlight the type in the graphical representation and display its information in the right pane.
As an example, select Film. The Film object type represents a film in the Star Wars universe. It has fields like title, episodeID, openingCrawl, characters, etc.
In GraphQL Voyager, fields are used to define the data that can be queried for a given type. You can explore the fields in Film by clicking on them in the left-side pane.
Once you have selected a field to explore, you can view its details, which include the field name, description, and the arguments it takes. You can also view the type of data returned by the field. Also, it highlights the fields in the right pane.
View relationships between types
You can explore relationships between types by clicking on the links between types in the graphical representation. This will highlight the related types and display information about the relationship in the right pane.
Search for types and fields
If you have a large schema with many types and fields, you can use the search box at the top of the screen to search for specific types and fields. Just type in a few letters of the name of the type or field you’re looking for, and GraphQL Voyager will filter the list of types and fields accordingly:
Filtering your search
GraphQL Voyager offers various options to help you refine your search further:
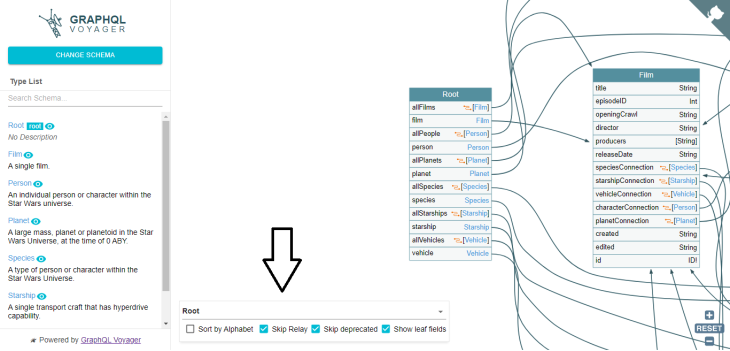
The “Sort by Alphabet” setting allows you to sort the nodes — i.e., types — in the schema alphabetically. By default, the nodes are sorted by the order in which they appear in the schema, but using this option can make it easier to find a specific node in a large schema.
Relay is a framework developed by Facebook for building data-driven React applications. If your schema includes Relay-specific types and fields, you can use the “Skip Relay” setting to exclude them from the visualization. This can be useful if you are not using Relay in your application and want to simplify the visualization.
The “Skip deprecated” setting allows you to exclude deprecated fields and types from the visualization. Deprecated fields and types are marked with a strikethrough in the visualization, but excluding them entirely can make the visualization easier to read.
By default, GraphQL Voyager only shows the top-level fields of each type in the visualization. Enabling the “Show leaf fields” setting will also show any “leaf” fields, which are fields that do not have any subfields. This can make it easier to see all the fields available on a type at a glance.
GraphQL Voyager caveats to consider
It’s important to consider compatibility when working with GraphQL Voyager. This data visualization tool relies on introspection queries to generate its visual representation of the schema. If the GraphQL server doesn’t support introspection, Voyager won’t work.
When it comes to performance, Voyager generates a visual representation of the entire schema, which can be a challenge for large and complex schemas. Make sure you monitor performance metrics and optimize queries as needed.
Using powerful GraphiQL features to construct queries
GraphiQL is an interactive web-based IDE that provides a user-friendly interface for writing and executing GraphQL queries.
The GraphiQL IDE is widely used by developers, as it allows you to explore and visualize your GraphQL schema by displaying the useable types and fields, as well as their documentation. With its built-in support explorer, you can easily view the information you need to write your queries.
One of the most useful features of GraphiQL is its power to provide real-time feedback on the GraphQL queries that are constructed.
As a user types a query into GraphiQL, it will immediately highlight any syntax errors and provide autocomplete suggestions for fields and arguments. This makes it easy to quickly write complex queries without having to remember the right syntax for each field.
Let’s go ahead and explore the GraphiQL interface with the Star Wars API (SWAPI) as an example.
SWAPI is a public API that provides data about Star Wars movies, characters, planets, and more. We will use GraphiQL to explore SWAPI and demonstrate some of the key features of the GraphiQL interface.
The GraphiQL interface has two main sections — the query editor and the results pane:

The query editor section is where we construct our GraphQL queries. The results pane displays the results of our queries in real-time. In the results pane, we can find the data that is returned by the API. Errors or warnings that are generated by our queries appear there as well.
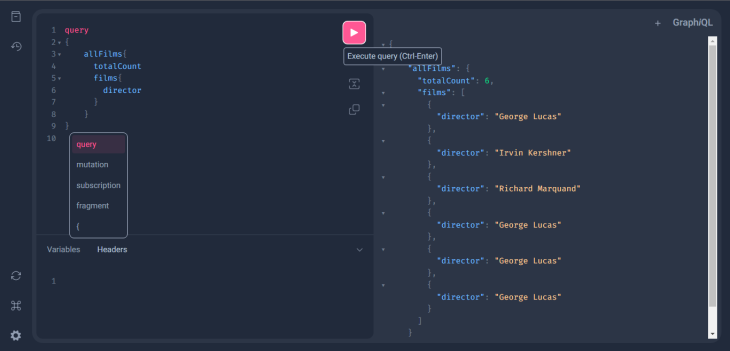
Now let’s start with a simple query that retrieves information about all Star Wars films. To construct this, we will use the allFilms field and retrieve three fields under it. Run the query below in the editor:
{ allFilms{ totalCount films{ director } }
}
Click the “play” button after pasting. This will transport the query to the SWAPI API, and display the results in the results pane. As you can see, the results pane displays the data that is returned by the API:
Using autocomplete in GraphiQL
One of the most powerful features of GraphiQL is its autocomplete functionality. As you type a query into the query editor, GraphiQL will provide autocomplete suggestions for fields and arguments. This way, you can create queries quickly without needing to remember the precise syntax for each field.
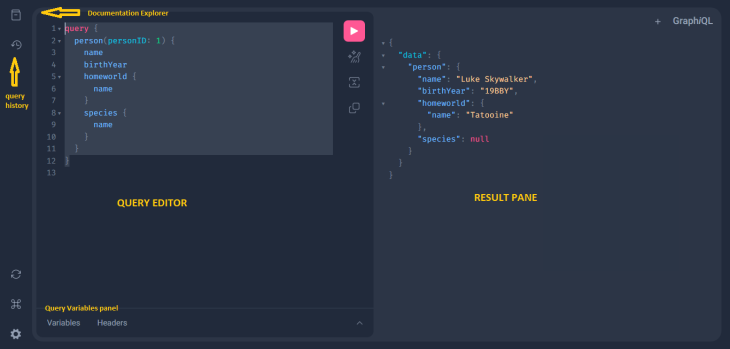
You can try creating a query that retrieves information about Luke Skywalker to test how autocomplete operates. As you start to type, GraphiQL will display autocomplete suggestions for available fields and arguments:
query { person(personID: 1) { name birthYear homeworld { name } species { name } }
}
The GraphiQL interface includes a number of buttons, features, and settings that allow you to customize GraphQL queries and view the data that is returned by the API. Here are some of the features you’ll find on the GraphiQL interface:
The query editor is the main text editor in the GraphiQL interface where you can write and edit your GraphQL queries. The editor program provides syntax highlighting, autocompletion, and error highlighting, making it easy to construct and debug complex queries.
The “play” button is one of the most important features on the GraphiQL interface, this button executes the GraphQL query that is currently in the query editor. When the Play button is clicked, your query is sent to the API and the results are displayed in the results pane.
The query variables panel allows you to define variables that can be used in your GraphQL queries. Variables can be defined with different data types and can be either required or optional.
As previously mentioned, the results panel displays the information that is returned by the GraphQL API in response to the query. The results are displayed in JSON format and can be expanded or collapsed to view nested data.
The query history feature allows you to save and manage your GraphQL queries. Saved queries can be easily retrieved and executed with a single click.
The settings panel allows you to customize the behavior of GraphiQL. The settings include options for enabling or disabling query validation, enabling or disabling schema introspection, and changing the theme of the interface:
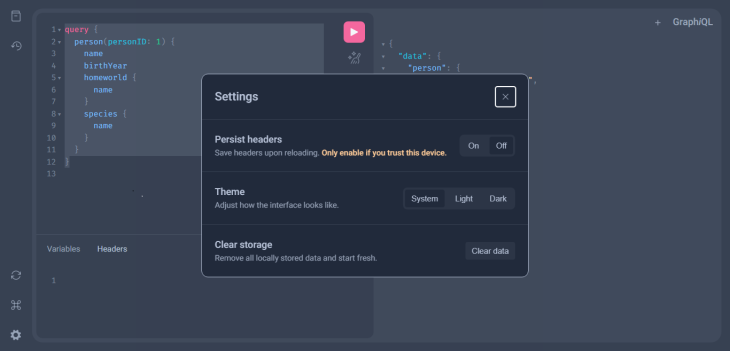
Finally, the documentation explorer feature provides support for the GraphQL API, including descriptions of types, fields, and arguments. This feature allows users to quickly and easily search for information about the API and its model.
Important considerations while using GraphiQL
Security is important in modern development. GraphiQL is a tool for debugging and exploring GraphQL APIs, but it’s not intended for production use. Ensure that proper security measures are in place when you’re interacting with sensitive data.
Additionally, like GraphQL Voyager, GraphiQL also relies on introspection queries to generate its interface. If the GraphQL server doesn’t support introspection, GraphiQL won’t work.
Using GraphQL Altair to work with APIs
GraphQL Altair is a powerful GraphQL client that provides a user-friendly interface for working with GraphQL APIs. It’s an open source project that allows developers to easily interact with GraphQL APIs, making it easier to test, debug, and optimize queries.
Altair’s interface is divided into several panels that allow you to perform various tasks. Here are the key features of the Altair interface:
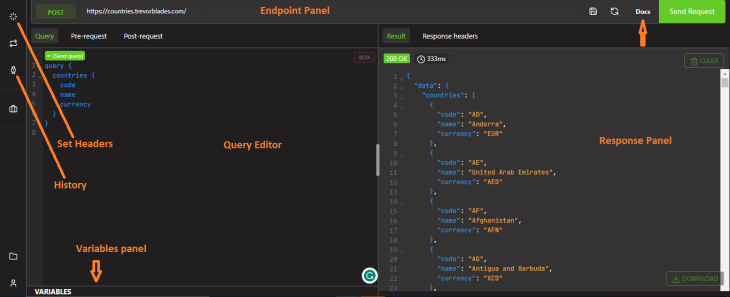
The endpoint panel allows you to enter the endpoint URL of the GraphQL API you want to connect to. Once you enter the URL, you can click the “Send Request” button to connect to the API and start working with its schema.
The query editor panel allows you to construct your GraphQL queries, mutations, and subscriptions. Altair provides you with syntax highlighting, code auto-completion, and error highlighting to make it easier to write valid GraphQL queries.
The panel labeled “VARIABLES” allows you to define variables that can be used in your GraphQL queries. You can create variables with different data types, and Altair will automatically generate the right input fields in the query editor:
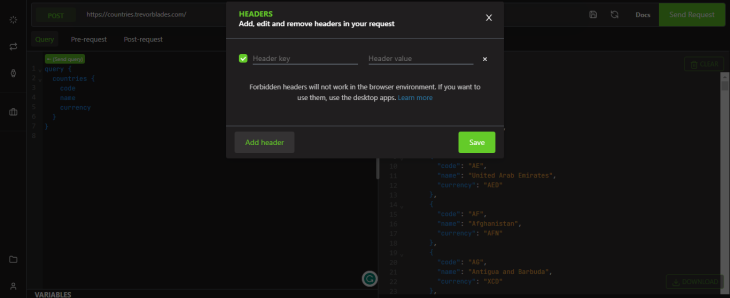
Altair also has a feature for setting headers that allows you to add custom headers to your GraphQL requests. You can define headers for authentication, caching, or other purposes:
The response panel displays the response from the GraphQL API you sent your query. You receive the response in either a JSON or a tree view format.
If you select “Docs” at the top right of your screen, to the left of the “Send Request” button, you should see a panel that provides a graphical representation of the GraphQL schema of the API you are working with. You can use this panel to explore the various types, fields, and relationships in the schema:
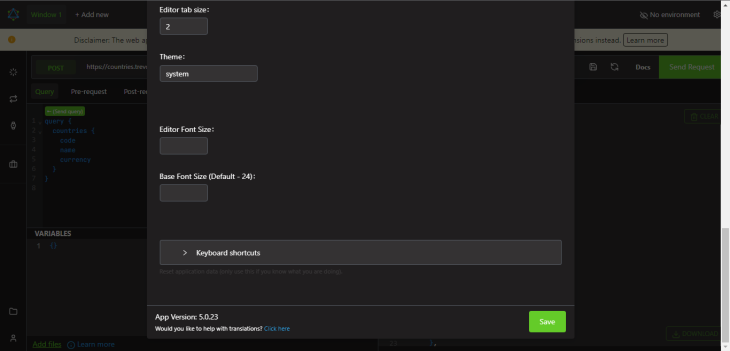
The “Settings” panel allows you to customize the appearance and behavior of Altair. You can tinker with settings such as theme, font size, and query timeout.
Altair keeps a history of all the queries you have executed, making it easy to revisit previous queries and results. It also provides real-time validation of your GraphQL queries, helping you to highlight errors and syntax issues as you write your queries.
Finally, Altair also provides an easy way to export your GraphQL queries as code snippets in various programming languages.
Demo of GraphQL Altair features
To see how Altair works, we can use any online demo of GraphQL Altair with the Trevorblades API.
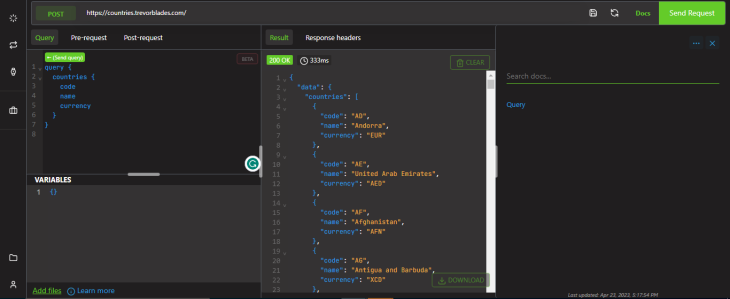
Open the GraphQL Altair demo page. In the “Endpoint” panel on the left-hand side of the page, paste the following endpoint URL:
https://countries.trevorblades.com/
Next, click on the “Send Request” button to connect to the Trevorblades API endpoint. If everything is set up correctly, you should see the schema of the API displayed in the right-side panel.
To test a query, mutation, or subscription, click on the “Query” button at the top of the page. This will open the query editor, where you can enter your GraphQL query.
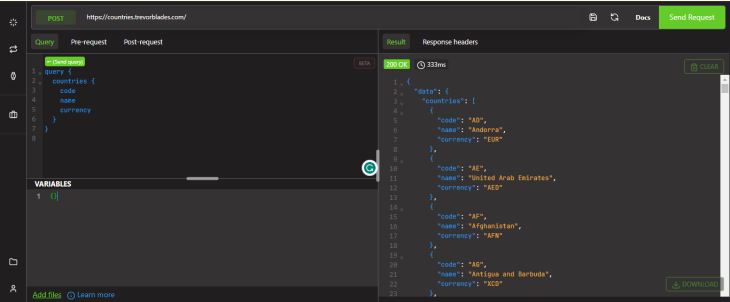
Next, enter a GraphQL query for the countries API in the editor. For example, you can try the following query to get information about all the countries in the API:
query { countries { code name currency } }
After you have entered your query, click on the “Send Request” button to execute it. The results of your query will be displayed in the response pane beside the query editor.
Considerations to keep in mind for GraphQL Altair
Altair has a slightly steeper learning curve than Voyager or GraphiQL, as it offers a greater range of features and customization options. This means you may need to invest time in learning the interface and functionality of Altair before you can fully benefit from it.
Furthermore, Altair requires additional dependencies to be installed, such as the Altair GraphQL client library. Ensure that you have the necessary dependencies installed and configured correctly to avoid any issues or errors.
Conclusion
When it comes to visualizing data for GraphQL, there are several great options available.
GraphQL Voyager offers a visually stunning representation of your GraphQL schema, while GraphiQL provides a straightforward and user-friendly interface. Altair, on the other hand, offers advanced features for debugging and testing your GraphQL queries.
Ultimately, the best data visualizer for GraphQL depends on your specific needs and preferences. Whether you’re looking for a simple and intuitive tool or a more advanced debugging and testing environment, there’s a data visualizer out there that’s right for you.
No matter which tool you choose, it’s important to remember that data visualization is a crucial part of working with GraphQL. By using a high-quality data visualizer, you can gain deeper insights into your data, identify potential issues more easily, and streamline your development process.
Don’t be afraid to try out different options and find the one that works best for you!
The post Exploring the best GraphQL data visualization tools appeared first on LogRocket Blog.
from LogRocket Blog https://ift.tt/G6loVyF
Gain $200 in a week
via Read more