In the past, the only image format that was supported by all browsers was the GIF, an image file developed by CompuServe. Then came the JPEG image file, which offered terrible compression without loss of any details, but the size is really small compared to the GIF image format.
After some time, the aim for advanced 2-dimensional vector computer graphics on the Web came into being. With so much competing formats that were submitted to W3C, SVG was finally developed in 1999.
Now that we published the CSS shapes tutorial, we wanted to show you how to create shapes with SVG. This tutorial will explain how to use SVG in web pages.
Your Designer Toolbox
Unlimited Downloads: 500,000+ Web Templates, Icon Sets, Themes & Design Assets
Table of Contents
- 1 Your Designer ToolboxUnlimited Downloads: 500,000+ Web Templates, Icon Sets, Themes & Design Assets
- 2 What is SVG?
- 3 Why Use SVG?
- 4 SVG on HTML Pages
- 5 Creating a Circle in SVG
- 6 Creating a Rectangle in SVG
- 7 Creating an Ellipse in SVG
- 8 Creating a Line in SVG
- 9 Creating a Polyline in SVG
- 10 Creating a Polygon in SVG
- 11 Creating Paths in SVG
- 12 Creating Text in SVG

DOWNLOAD NOW![]()
What is SVG?
SVG, which stands for Scalable Vector Graphics, is an XML-based vector image format for the Web. Unlike GIF, PNG and JPEG image file formats, SVG is scalable, which means that no matter how you scale or enlarge the image file, the quality will still look good.
As an XML file, SVG can be created, customized and integrated with other W3C standards such as DOM and XSL using any text editor. SVG images can also be created visually using drawing or vector programs like Adobe Illustrator.
Why Use SVG?
- Can be created and edited with any text editor
- Can be printed with high quality resolution
- Can be used for animation
- Is a W3C recommendation
- Works with other W3C standards like DOM
- Looks great for retina diplays
- Scales to any size without looking stretch out
SVG on HTML Pages
SVG can be easily embedded into HTML using SVG tags. Consider the syntax below.
<svg width=" " height=" ">
[element code here..]
</svg>
As you can see, SVG has its own tags. SVG must have a width and height so as to contain its element. The following are the elements can be used to draw inside its canvas.
- Circle
- Rectangle
- Ellipse
- Line
- Polyline
- Polygon
- Path
- Text
So let’s jump in and start this awesome tutorial.
Creating a Circle in SVG
Circle SVGs can be executed by using the circle tag. Here’s an example.
<svg height="300" width="300"> <circle cx="60" cy="60" r="50" style="fill: blue; stroke: black; stroke-width: 2px;" />
</svg>
The resulting Circle SVG image will look like this:
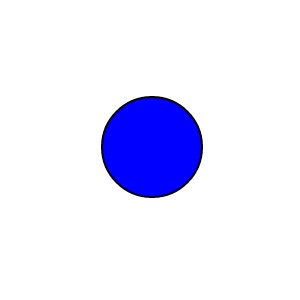
In this example, I used the circle tag and then define the cx (x coordinates) and cy (y coordinates) which will determine the center of the circle. Next, I put a value of 50 on the r (radius), which defines the length of a line segment from its center to its perimeter. Finally, I added the styles for fill color, stroke color and stroke-width, which are pretty much self- explanatory.
Creating a Rectangle in SVG
Rectangle can be executed by using rectangle tag and can draw various kinds of height and width. Check out the code below.
<svg height="300" width="300"> <rect width="250" height="100" rx="11" ry="11" style="fill: yellow; stroke: green; stroke-width: 4px;"/>
</svg>
The resulting Rectangle SVG image will look like this:
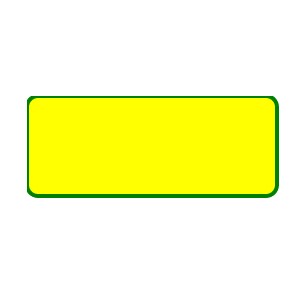
Using rectangle tag, I define the width and the height of the rectangle. Then I added rx and ry, which rounds the edge of the rectangle. You can remove this two (rx and ry) if you want to have sharp edges. Next we added the styles for fill color, stroke color and stroke-width.
Creating an Ellipse in SVG
Ellipse SVG can be executed by using the ellipse tag. Ellipses don’t need to have equal height and width and unlike circle SVG the radius (cx and cy) is different. Consider the code below.
Consider the code below.
<svg height="300" width="300"> <ellipse cx="190" cy="70" rx="100" ry="50" style="fill:red; stroke:green;stroke-width:2"/>
</svg>
The resulting Ellipse SVG image will look like this:
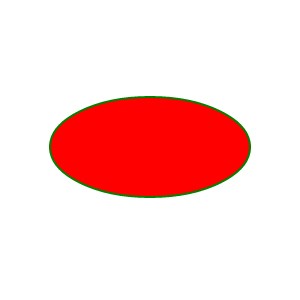
The cx and cy define the center of the ellipse while the rx and ry define the radius of the ellipse. As you can see, the rx describes the wideness of the ellipse while the ry describes how tall it will be. Then we put up the styles for fill color, stroke color and stroke width.
Creating a Line in SVG
Line SVG can be executed by using the line tag. From the name itself, the tag is used to draw lines. Check out the example below.
<svg height="300" width="300"> <line x1="0" y1="0" x2="100" y2="150" style="stroke:#000; stroke-width:5" />
</svg>
The resulting Line SVG image will look like this:
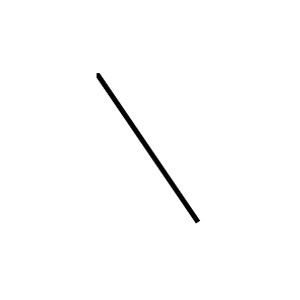
On this example, x1 (x-axis) and y1 (y-axis) define the starting point of the line. While x2 (x-axis) and y2 (y-axis) define the ending point of the line. Using the style attribute, I put a stroke color of black and a 5px stroke width.
Creating a Polyline in SVG
A polyline SVG can be executed by using the polyline tag. It is used to draw shapes which are composed of straight lines. Here’s an example.
<svg height="300" width="300"> <polyline points="60,50 150,120 100,220 200,170" style="fill:none;stroke:black;stroke-width:3" />
</svg>
The resulting Polyline SVG image will look like this:
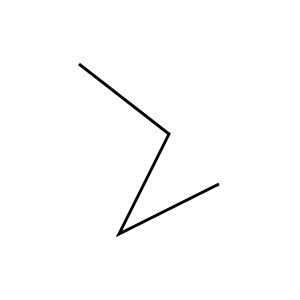
Using x (x-axis) and y (y-axis), you can set the each individual points of the lines to create a specific shape you want. As you can see here I have 4 set up points joined by lines. I also added a stroke of black and a stroke-width of 3px.
Creating a Polygon in SVG
Polygon SVG can be executed by using the polygon tag. This element will draw shape that has more than 3 sides. Check out the code below.
<svg height="300" width="300"> <polygon points=" 60,20 100,40 100,80 60,100 20,80 20,40" style="fill:cyan;stroke:red;stroke-width:1" />
</svg>
The resulting Polygon SVG image will look like this:
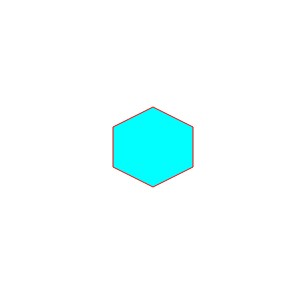
In Polygon SVG, points are being defined by the x and y axis for each side of the polygon from the last point to last one. In this example, I created a hexagon with 6 sides. As you can see, there are 6 points that connects together defined by x and y axis. Then I put fill color of cyan followed by stroke color of red and stroke width of 1px.
Creating Paths in SVG
Path SVG can be executed by using the path tag. This element will draw advance path and shapes which consists of curves, lines, and arcs. Among the entire SVG elements, this is one of the most functional yet hardest to learn and manipulate. Path SVG uses the following commands:
- M move to
- L line to
- V vertical line to
- H horizontal line to
- C curve to
- S smooth curve to
- T quadratic Bézier curve
- A elliptical arc
- Z close path
Uppercase letters mean the position will absolutely position while lowercase letters mean relative positioning. See the example below.
<svg height="300" width="300">
<path d="M 30 40 C 140 -30 180 90 20 160 L 120 160" style="fill: none; stroke: black; stroke-width: 6px;" />
</svg>
The resulting Path SVG image will look like this:

From the code above, you can see that I used the letter d. This d attribute will always be a move command. Next, I use M which means move to. Before you can draw anything, you must move the virtual cursor to your preferred location.
So for this example, I move the x-axis to 30 white the y-axis to 40. The curve begins at 140, -30 as our tangent starting point. Next the curve points down to the right with the points 180, 90 and ends up with 20, 160. To finalize the path, I created a line with points 120 and 160.
Creating Text in SVG
Text SVGs can be executed by using the tag enclosed with the text tag. This element is used to draw text in an SVG image.
<svg height="300" width="300"> <text x="20" y="30" fill="blue" font-size="20">This a great sample for Text SVG! </text>
</svg>
The resulting Text SVG image will look like this:

In this example, I set the x-axis position of the text to 20. This will place the text 20 px from the left while I set up the y-axis to 30, which will place the text 30 px from the top. Next, I set up a fill color of blue and set the font size to 20px. This will display the text “This a great sample for Text SVG!”
This post may contain affiliate links. See our disclosure about affiliate links here.


