
This tutorial explains how to use the Performance API to record DevTool-like statistics from real users accessing your application.
Assessing web application performance using browser DevTools is useful, but it’s not easy to replicate real-world usage. People in different locations using different devices, browsers, and networks will all have differing experiences.
An Introduction to the Performance API
Table of Contents
The Performance API uses a buffer to record DevTool-like metrics in object properties at certain points in the lifetime of your web page. Those points include:
- Page navigation: record page load redirects, connections, handshakes, DOM events, and more.
- Resource loading: record asset loading such as images, CSS, scripts, and Ajax calls.
- Paint metrics: record browser rendering information.
- Custom performance: record arbitrary application processing times to find slow functions.
All the APIs are available in client-side JavaScript, including Web Workers. You can detect API support using:
if ('performance' in window) { // call Performance APIs } Note: be aware that Safari doesn’t support all methods, despite implementing most of the API.
The custom (user) performance APIs are also replicated in:
- the Node.js built-in performance_hook module, and
- the Deno performance API (scripts using it must be run with the
--allow-hrtimepermission).
Isn’t Date() Good Enough?
You may have seen examples using the Date() function to record elapsed times. For example:
const start = new Date(); // ... run code ... const elapsed = new Date() - start; However, Date() calculations are limited to the closest millisecond and based on the system time, which can be updated by the OS at any point.
The Performance API uses a separate, higher-resolution timer that can record in fractions of a millisecond. It also offers metrics that would be impossible to record otherwise, such as redirect and DNS lookup timings.
Recording Performance Metrics
Calculating performance metrics in client-side code is useful if you can record it somewhere. You can send statistics to your server for analysis using Ajax Fetch / XMLHttpRequest requests or the Beacon API.
Alternatively, most analytic systems offer custom event-like APIs to record timings. For example, the Google Analytics User Timings API can record the time to DOMContentLoaded by passing a category ('pageload'), variable name ("DOMready"), and a value:
const pageload = performance.getEntriesByType( 'navigation' )[0]; ga('send', 'timing', 'pageload', 'DOMready', pageload.domContentLoadedEventStart); This example uses the Page Navigation Timing API. so let’s start there …
Testing your site on a fast connection is unlikely to be indicative of user experience. The browser DevTools Network tab allows you to throttle speeds, but it can’t emulate poor or intermittent 3G signals.
The Navigation Timing API pushes a single PerformanceNavigationTiming object to the performance buffer. It contains information about redirects, load times, file sizes, DOM events, and so on, observed by a real user.
Access the object by running:
const pagePerf = performance.getEntriesByType( 'navigation' ); Or access it by passing the page URL (window.location) to the getEntriesByName() method:
const pagePerf = performance.getEntriesByName( window.location ); Both return an array with a single element containing an object with read-only properties. For example:
[ { name: "https://site.com/", initiatorType: "navigation", entryType: "navigation", initiatorType: "navigation", type: "navigate", nextHopProtocol: "h2", startTime: 0 ... } ] The object includes resource identification properties:
| property | description |
|---|---|
| name | the resource URL |
| entryType | performance type — "navigation" for a page, "resource" for an asset |
| initiatorType | resource which initiated the download — "navigation" for a page |
| nextHopProtocol | network protocol |
| serverTiming | array of PerformanceServerTiming objects |
Note: performanceServerTiming name, description, and duration metrics are written to the HTTP Server-Timing header by the server response.
The object includes resource timing properties in milliseconds relative to the start of the page load. Timings would normally be expected in this order:
| property | description |
|---|---|
| startTime | timestamp when fetch started — 0 for a page |
| workerStart | timestamp before starting the Service Worker |
| redirectStart | timestamp of the first redirect |
| redirectEnd | timestamp after receiving the last byte of the last redirect |
| fetchStart | timestamp before the resource fetch |
| domainLookupStart | timestamp before the DNS lookup |
| domainLookupEnd | timestamp after the DNS lookup |
| connectStart | timestamp before establishing a server connection |
| connectEnd | timestamp after establishing a server connection |
| secureConnectionStart | timestamp before the SSL handshake |
| requestStart | timestamp before the browser request |
| responseStart | timestamp when the browser receives the first byte of data |
| responseEnd | timestamp after receiving the last byte of data |
| duration | the time elapsed between startTime and responseEnd |
The object includes download size properties in bytes:
| property | description |
|---|---|
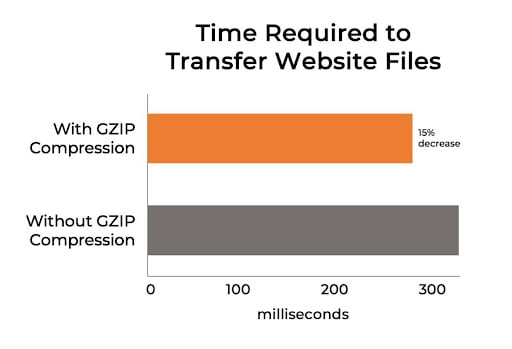
| transferSize | the resource size, including the header and body |
| encodedBodySize | the resource body size before decompressing |
| decodedBodySize | the resource body size after decompressing |
Finally, the object includes further navigation and DOM event properties (not available in Safari):
| property | description |
|---|---|
| type | either "navigate", "reload", "back_forward" or "prerender" |
| redirectCount | number of redirects |
| unloadEventStart | timestamp before the unload event of the previous document |
| unloadEventEnd | timestamp after the unload event of the previous document |
| domInteractive | timestamp when HTML parsing and DOM construction is complete |
| domContentLoadedEventStart | timestamp before running DOMContentLoaded event handlers |
| domContentLoadedEventEnd | timestamp after running DOMContentLoaded event handlers |
| domComplete | timestamp when DOM construction and DOMContentLoaded events have completed |
| loadEventStart | timestamp before the page load event has fired |
| loadEventEnd | timestamp after the page load event. All assets are downloaded |
Example to record page loading metrics after the page has fully loaded:
'performance' in window && window.addEventListener('load', () => { const pagePerf = performance.getEntriesByName( window.location )[0], pageDownload = pagePerf.duration, pageDomComplete = pagePerf.domComplete; }); Continue reading How to Make Your Site Faster with the Performance API on SitePoint.