You’ve built a website, but how well does it perform for your end users? It’s crucial to ask this question, but how can you get answers? One excellent option is to use Lighthouse.
Lighthouse allows you to easily and automatically analyze a web page’s performance and quality. It provides tools that let you understand how to improve your web page’s performance, accessibility, SEO and more. Using these scores to enhance your website will ultimately lead to attracting more users and increasing your website’s rank in search engines.
In this article, we’ll explore the importance of website performance, which is the highlight of Lighthouse’s scoring. We’ll also look at why we should use Lighthouse; how to use Lighthouse, both via Chrome and via the Lighthouse CLI; and the various audits Lighthouse can perform to score your web page, and why they’re important. We’ll also cover how some common performance and other website issues can be resolved.
We’ll also look at how to use WebPageTest, another powerful tool for assessing site performance.
Why Performance Is Important
Table of Contents
If you look at some of the world’s best websites, they all have one thing in common: they provide their users with a superior experience. There are many reasons for this, but one of the most important ones is performance. Users love a fast website. The longer they have to wait for a website to load, the more likely they’ll leave the website in search of a better one that allows them to do what they need to do without the wait.
Improving your website’s performance can lead to a higher SEO ranking (as we’ll see in more details later in the article), and a boost in click-through and conversion rates. So, if you want more sales, sign-ups, or traffic, you’ll first have to ensure that your website’s performance is up to scratch.
Why Use Lighthouse
Lighthouse is an open-source tool created by Google. As Google is a reputable company that’s trusted by many, it makes the result more reliable than other tools. Furthermore, as Google’s search engine is the leading search engine for the past decade, appearing higher on their search engine will most likely result in more traffic. So, getting a higher score on their performance audit tool can potentially raise the ranking of your website in their search results.
But other than the fact that Lighthouse was created by Google, what makes it a good tool is its detailed results that have the user’s best interest at heart. Lighthouse provides many results concerning how long it takes the page to load, if the page (and ultimately the website) is secure, if the page’s accessibility practices and implementations allow for inclusivity of all users, and more.
How to Use Lighthouse
In this section, we’ll first go through the easiest way to use Lighthouse to analyze and check the score of a web page, which is done directly through Chrome. Then, we’ll check other Lighthouse tools that might provide even more detailed results or options.
Using Chrome
Using Lighthouse through Chrome is the easiest method to measure your website’s performance. First, open any web page that you’d like to measure. To demonstrate, I’ll be using some results from an audit run on my website and on GitHub for us to see a variety of sample results.
Next, open the devtools either by clicking shift + control + J or F12 on Windows/Linux, or option + command + J or fn + F12 on macOS.
After that, click on the Lighthouse tab.
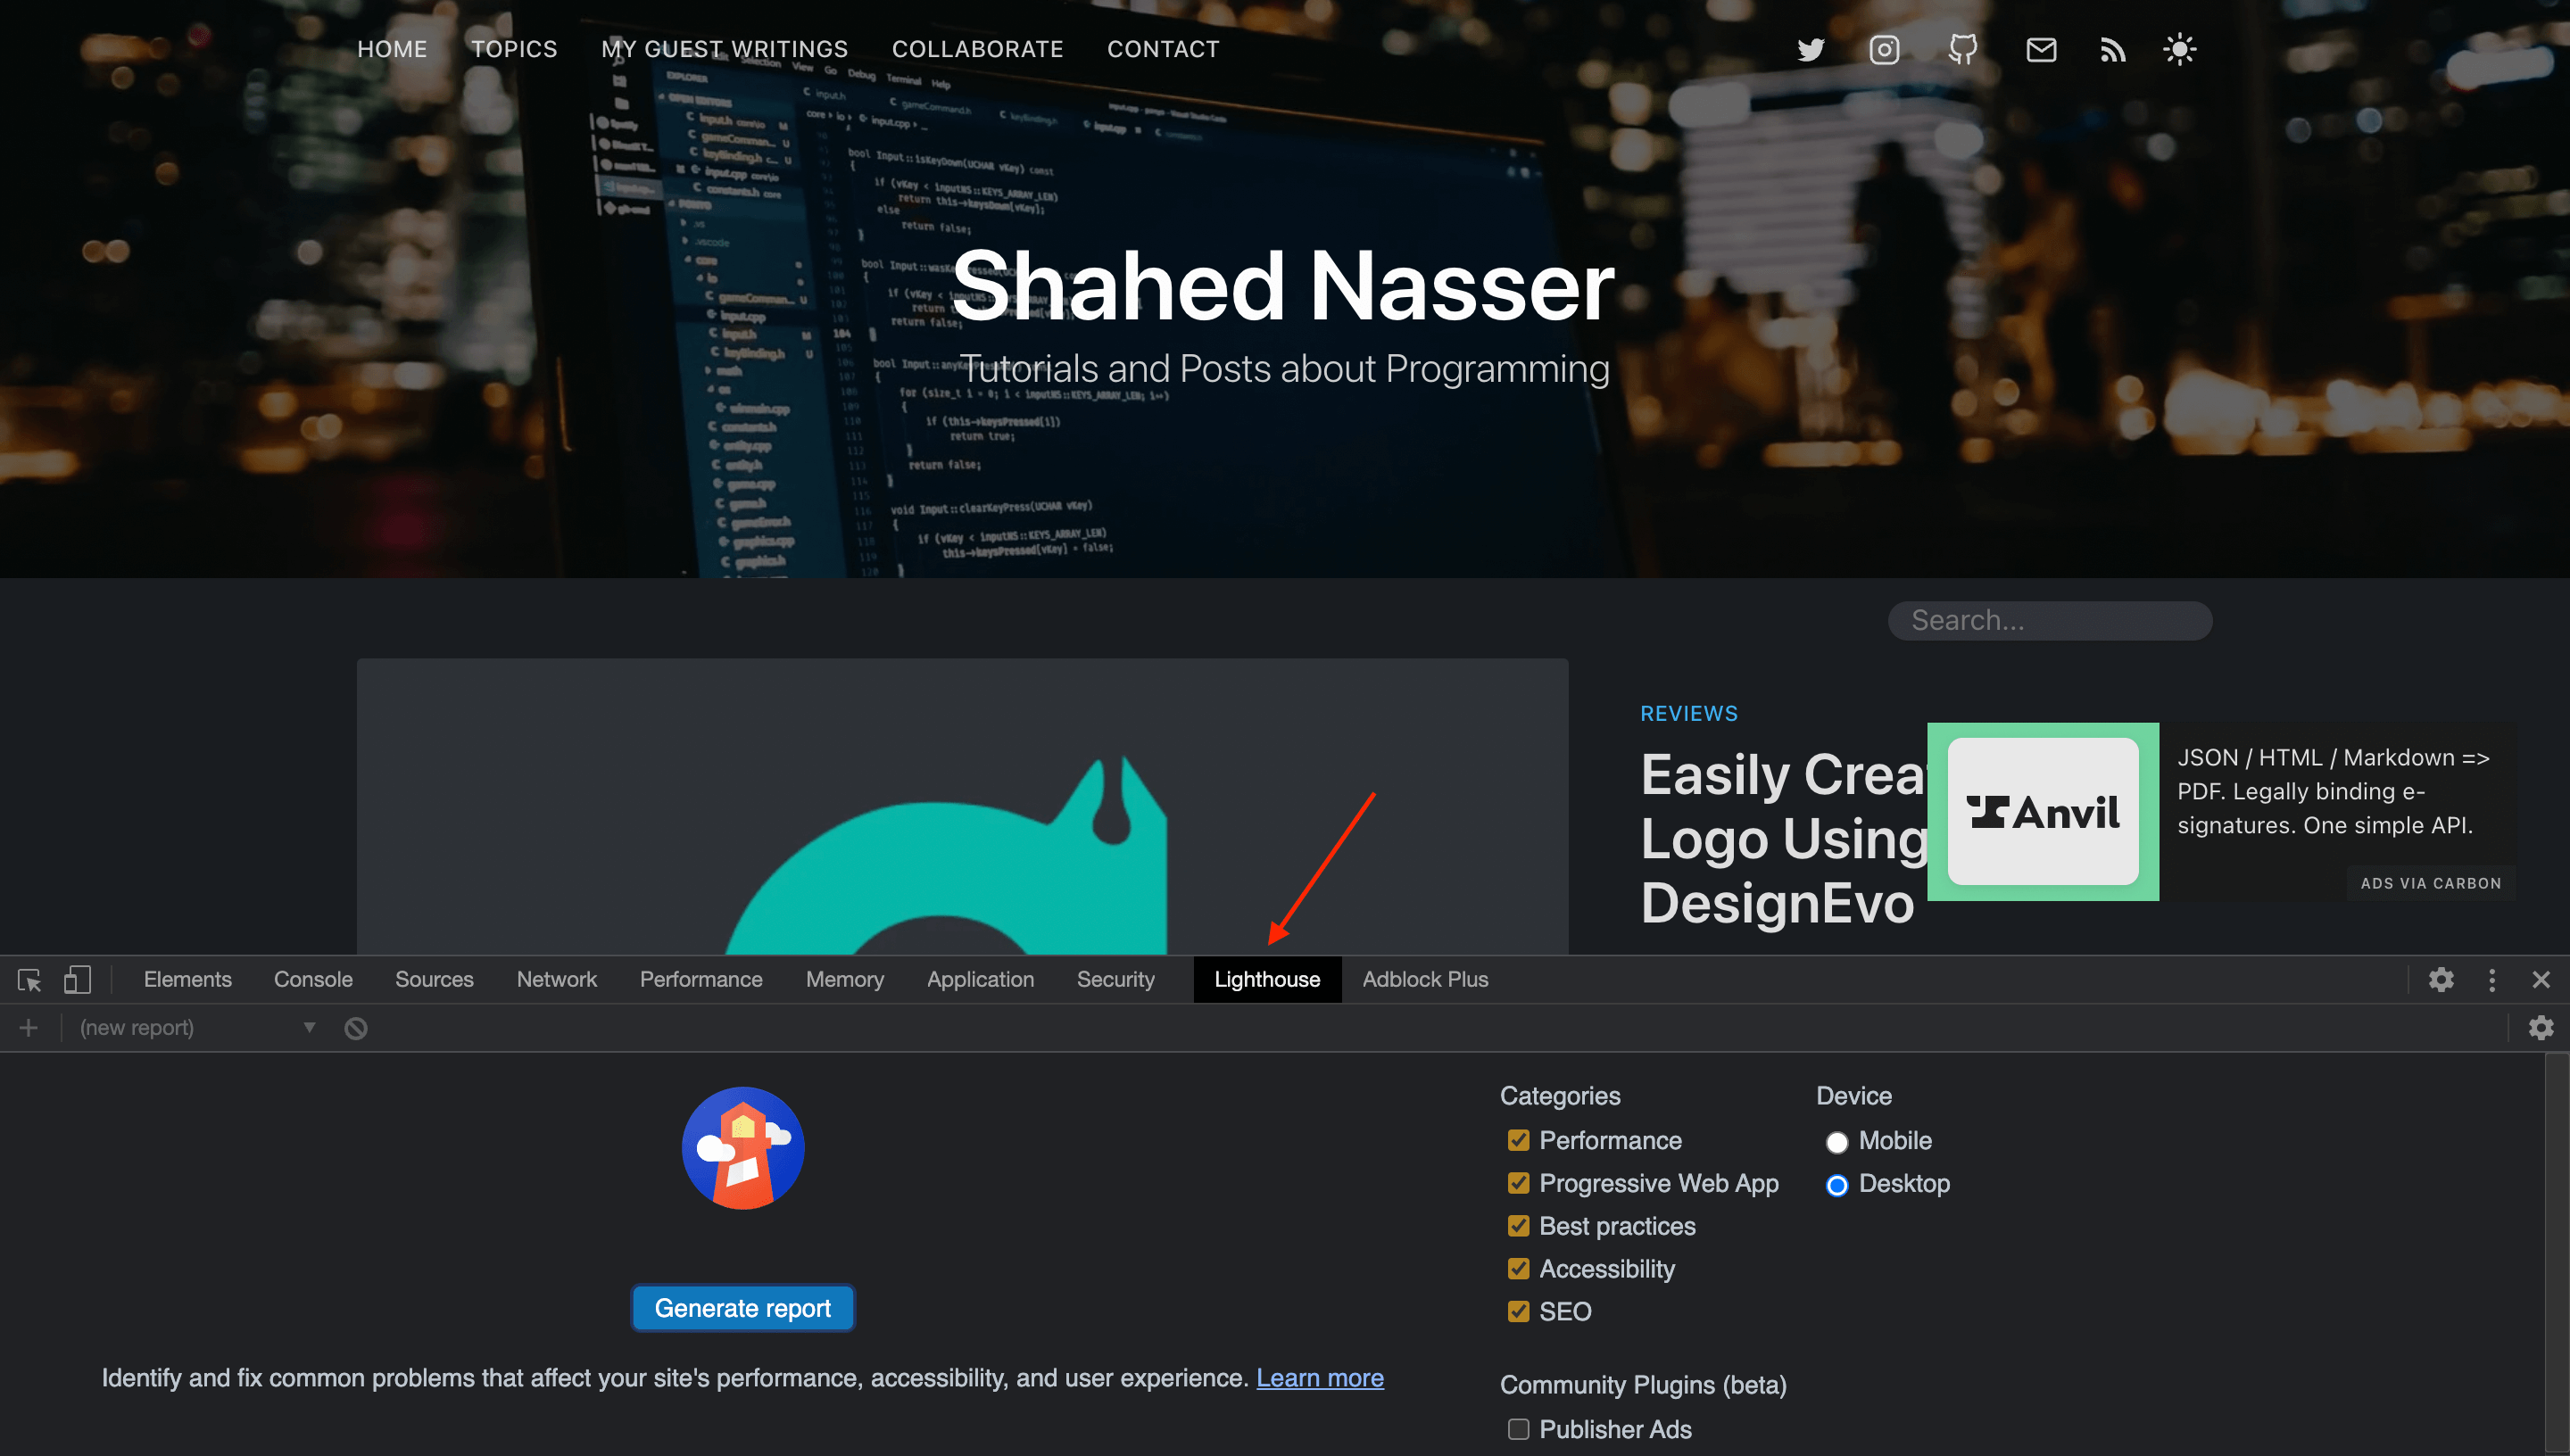
As you can see, you can choose which categories you want the audit to include. These categories are Performance, Progressive Web App, Best Practices, Accessibility, and SEO. You can also choose whether you want the audit to run on Mobile or Desktop.
In this section, we’ll perform four audits which are Performance, Best Practices, Accessibility, and SEO, and we’ll run them on Desktop. However, to achieve optimal results, it’s important to test your web page under different conditions — such as on Mobile and at different internet speeds.
So, on the web page you want to measure, go ahead and choose the four categories mentioned and Desktop, then click Generate Report.
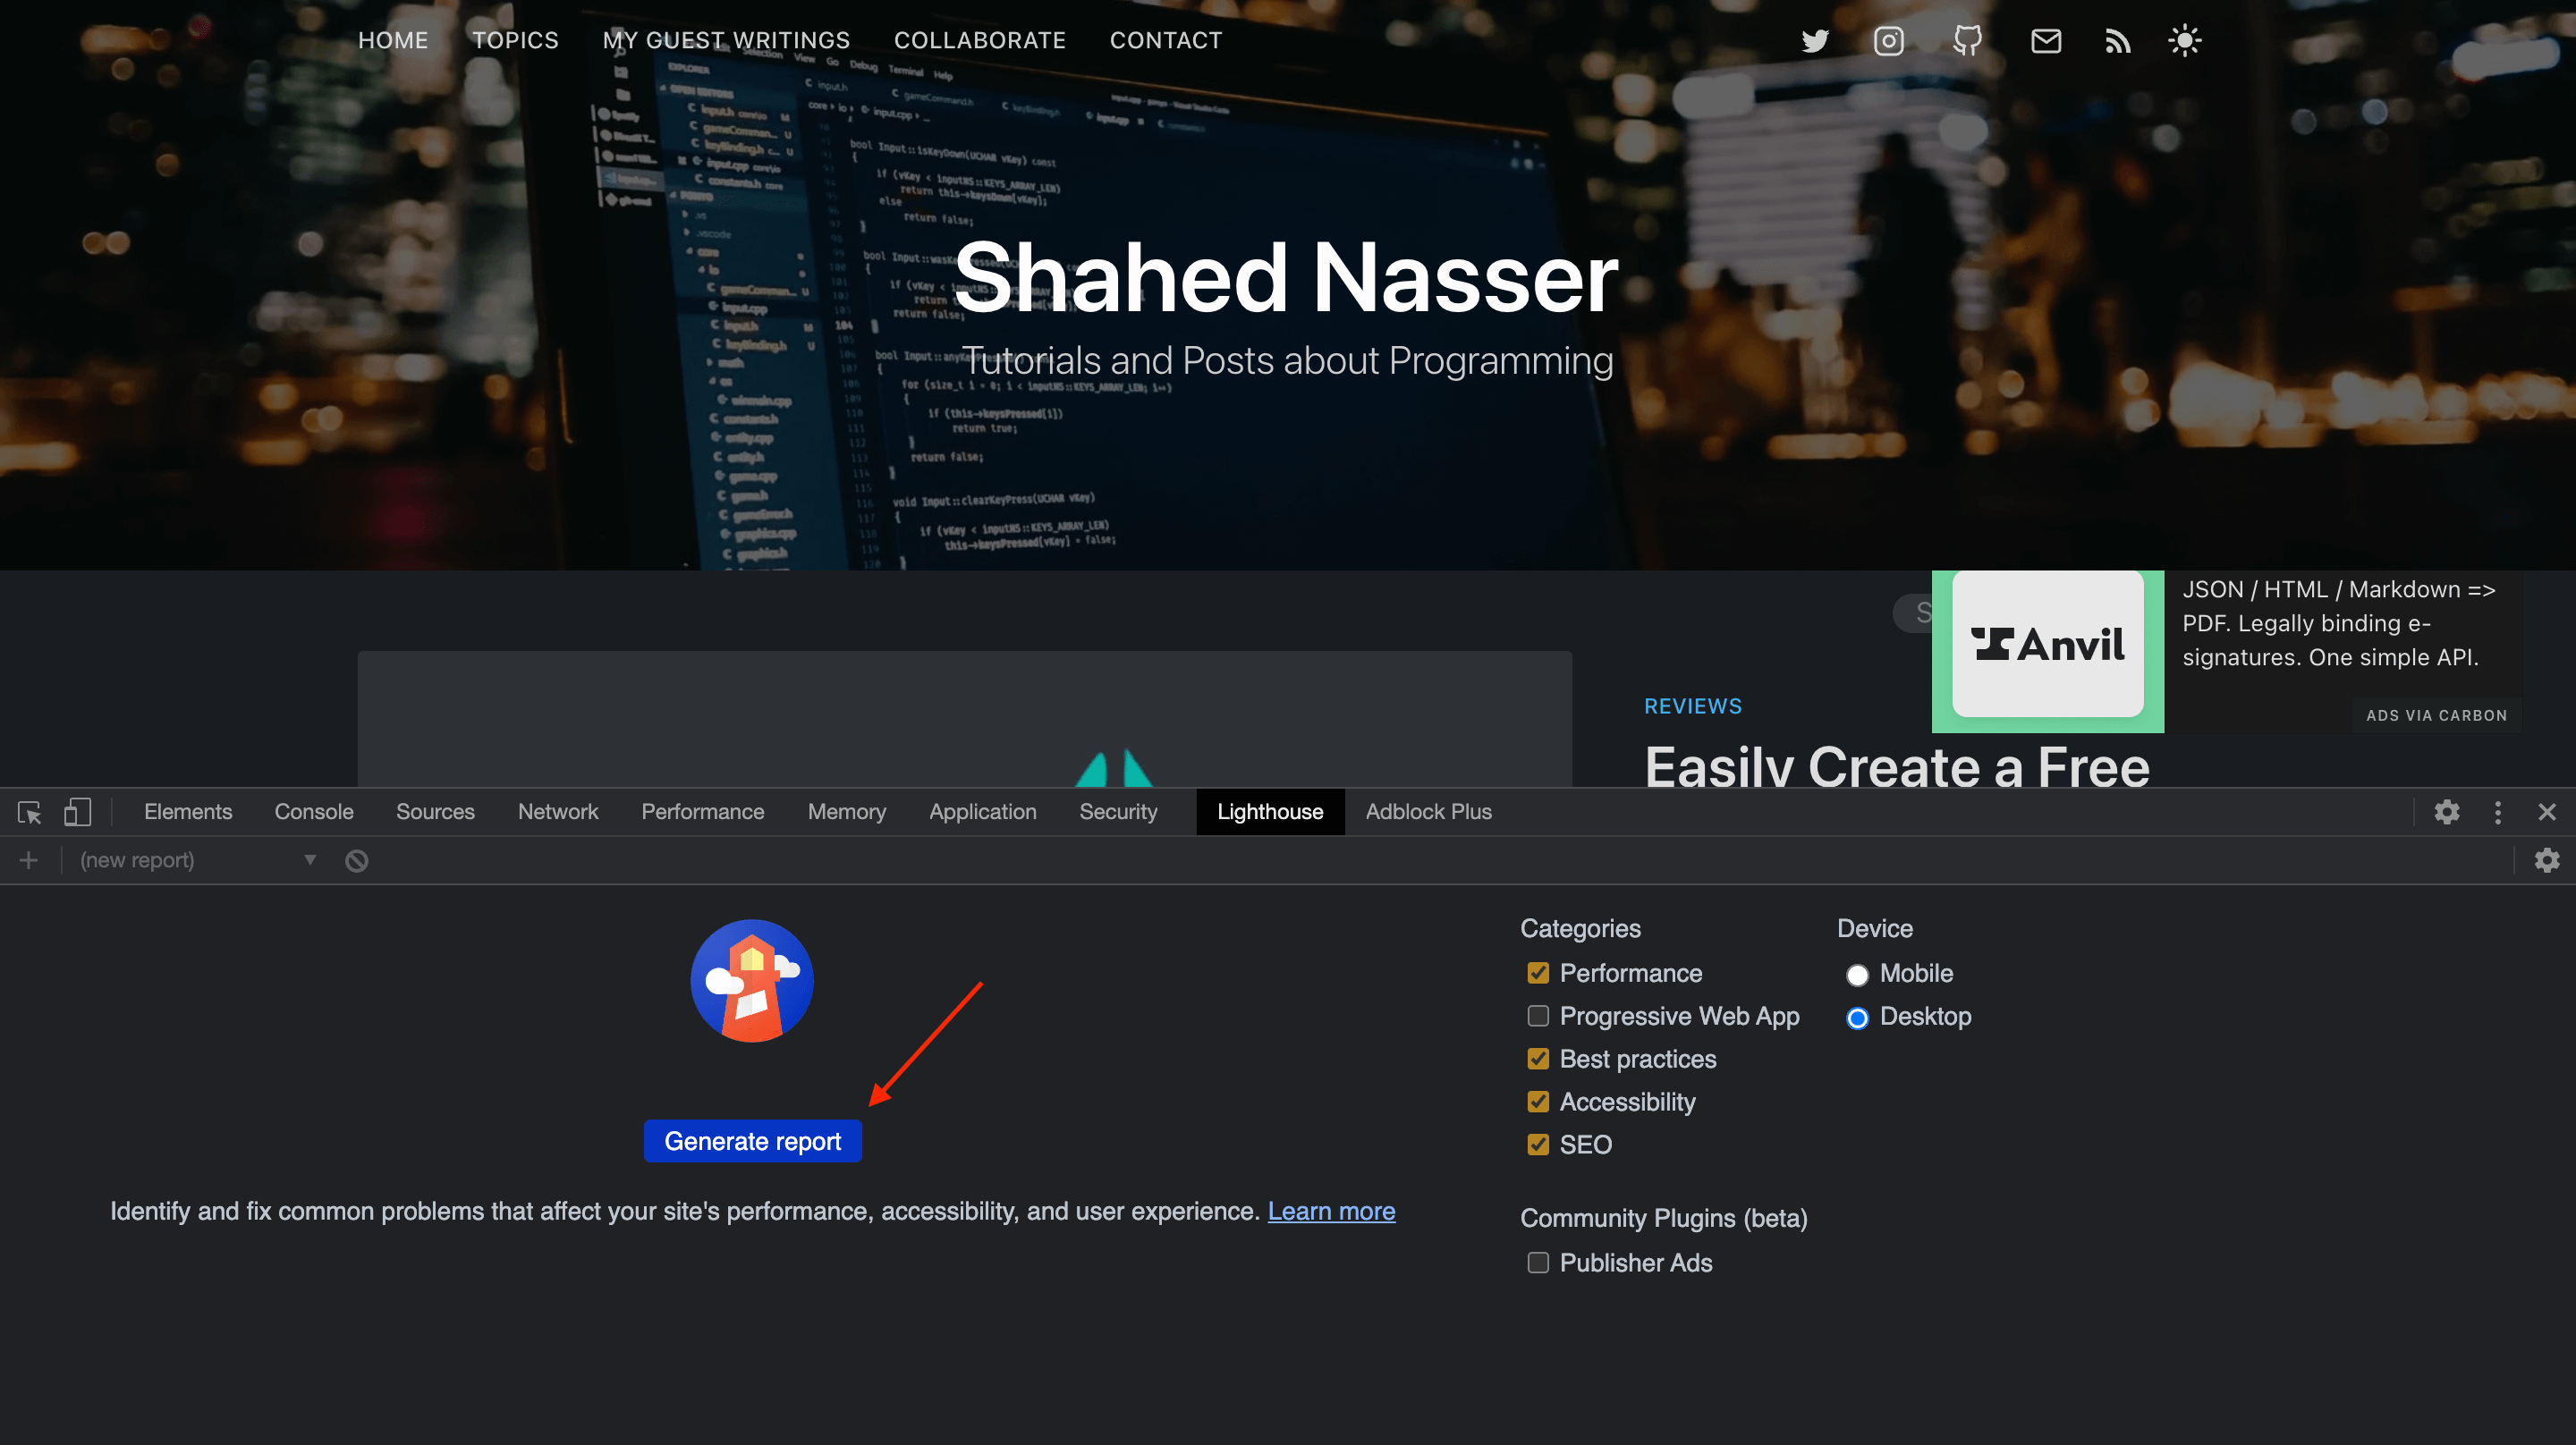
This can take a few minutes, and you’ll see that your browser’s window might grow and shrink through the process. This is because the report entails different screen sizes and conditions for your web page. Once it’s done, the Lighthouse tab will include the result for the audit, which will include the score for each of Performance, Best Practices, Accessibility, and SEO.
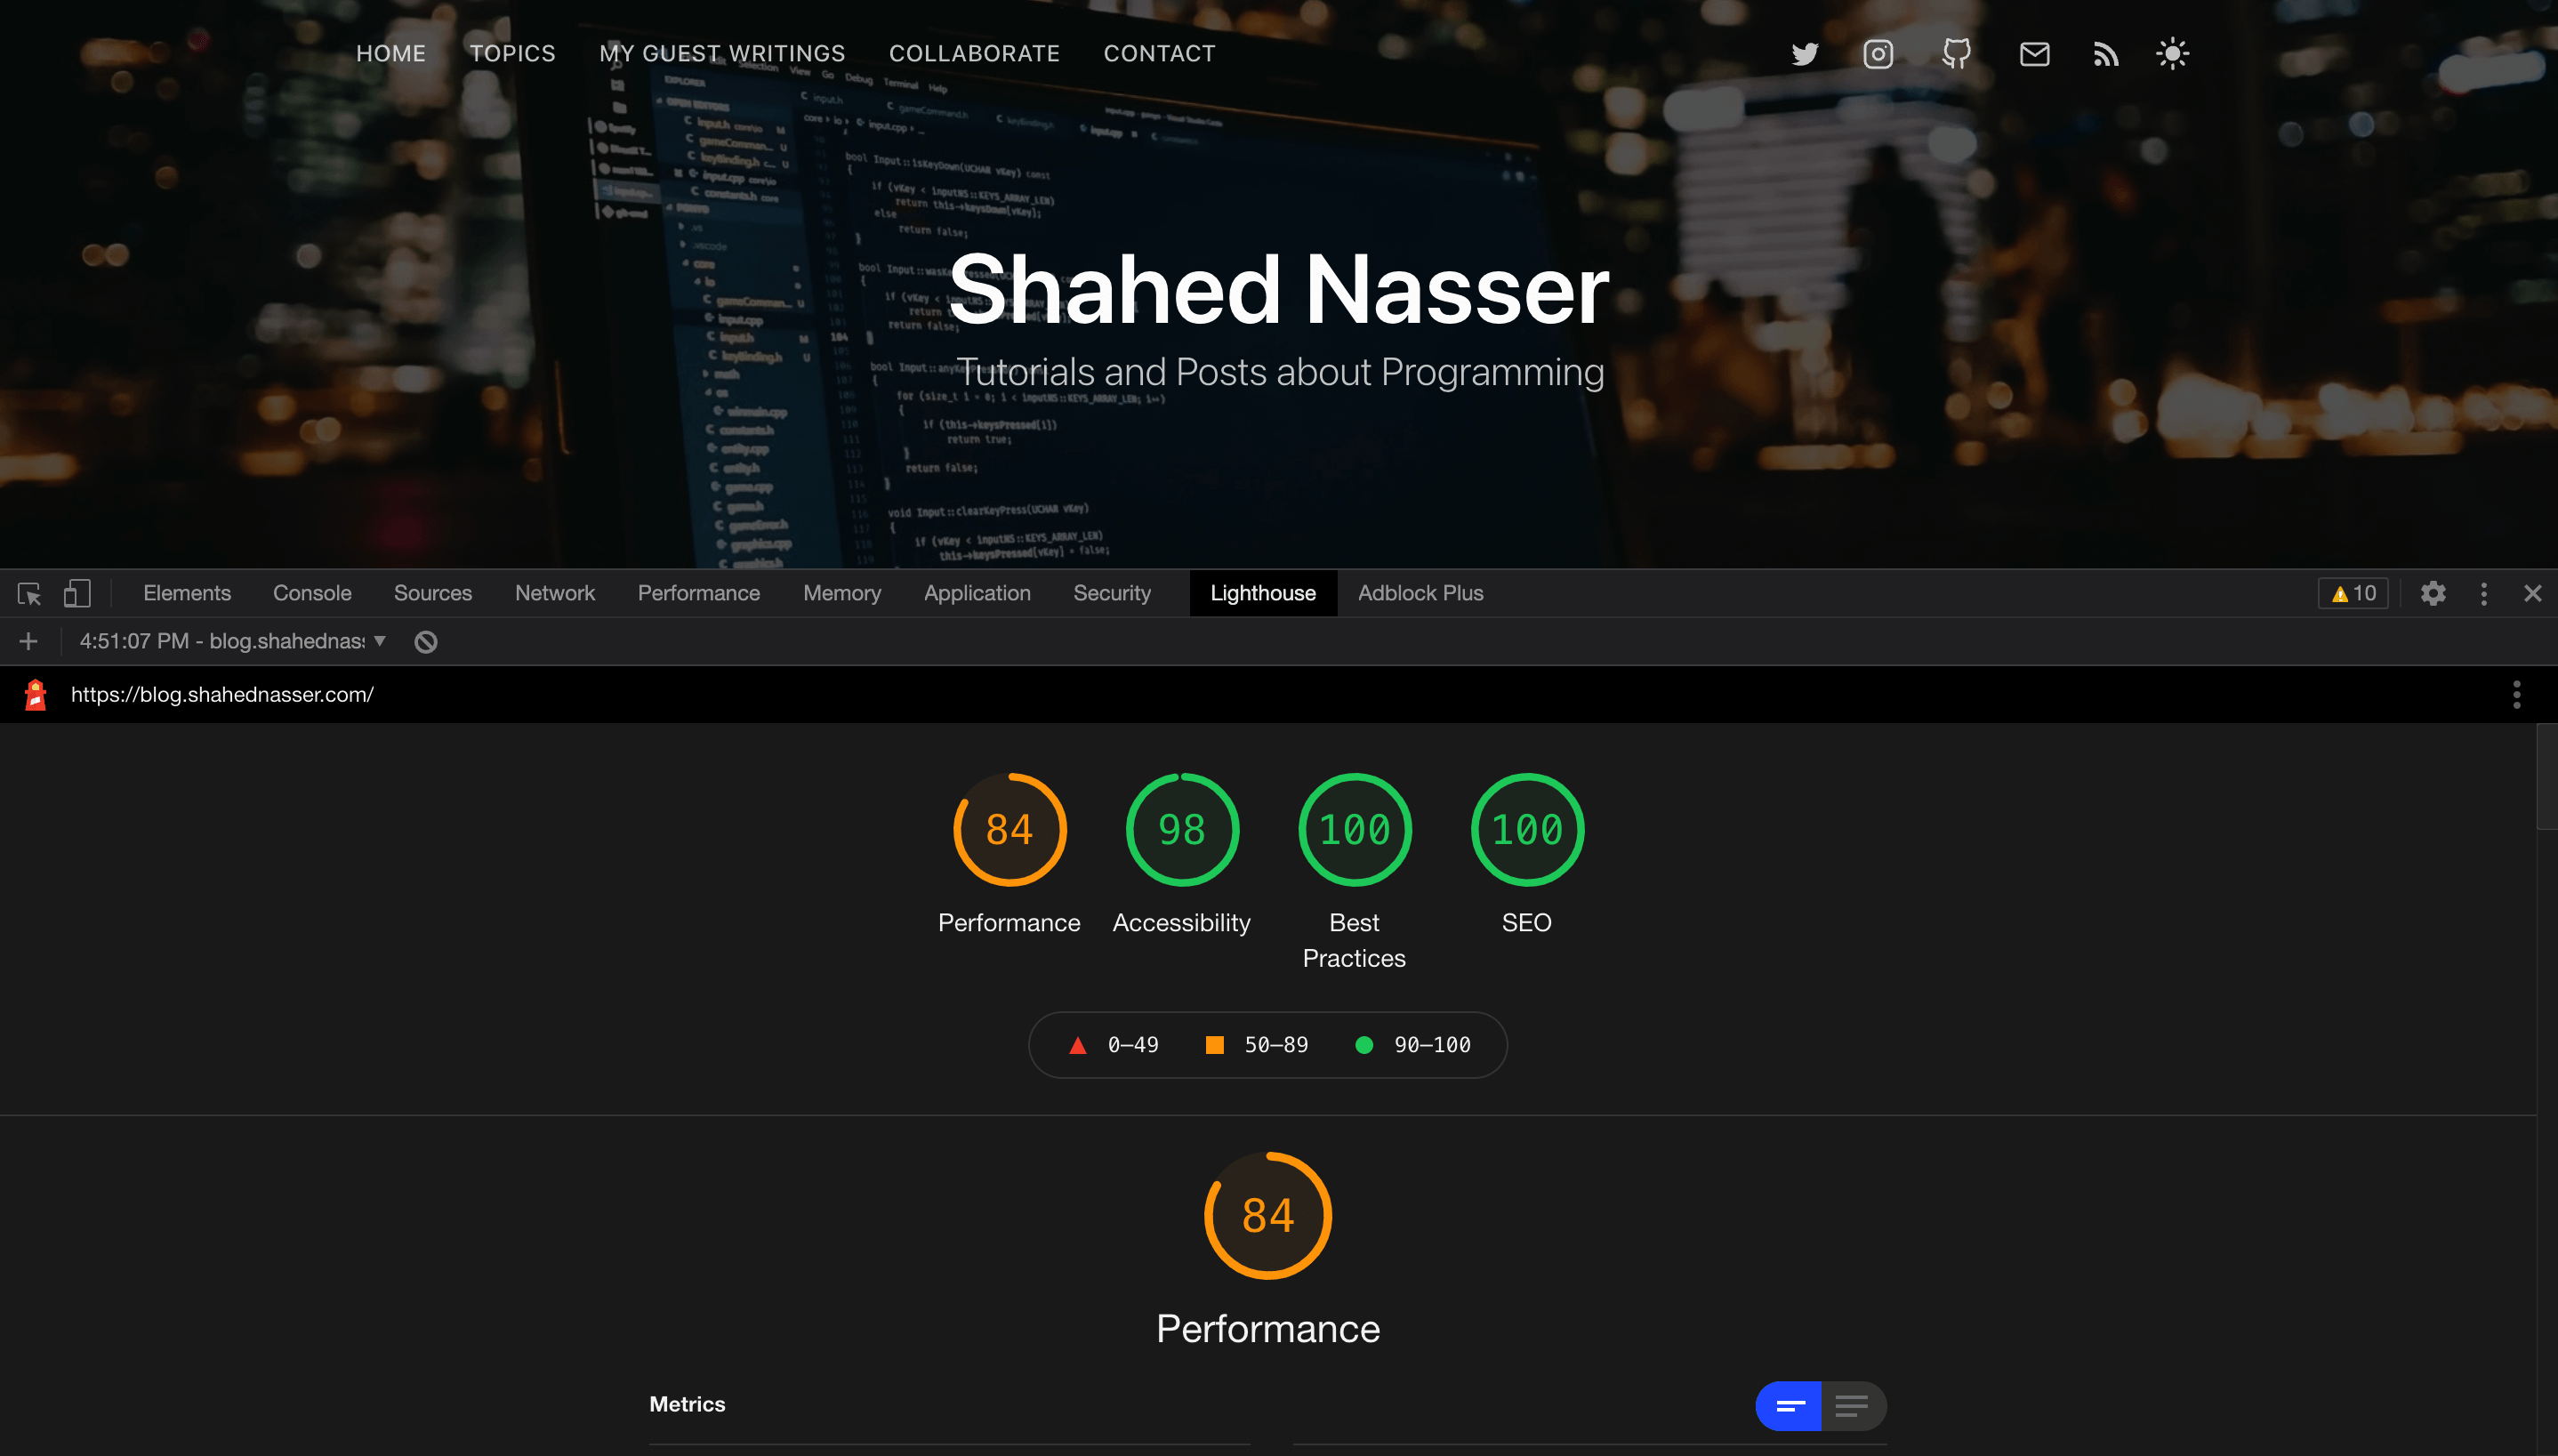
It should be noted that sometimes the results can be different based on your internet connection. Also, sometimes Lighthouse can show a notice that some extensions might have affected the result. If so, it’s probably best to run the test in an Incognito Window.
When Lighthouse has finished running, you can click on any of the categories to see a more detailed report.
Performance
Performance focuses on how to make your website load faster. We’ll go over the six important metrics for Performance, what they each entail and how to achieve a better score in each of them.
First Contentful Paint (FCP)
The first contentful paint (FCP) is measured from the moment the user navigates to the web page. It measures how long it takes for the first piece of DOM content to load. The DOM content can include images, non-white canvas elements, and SVG elements.
FCP is measured in seconds. In order for your web page to have a “Green” score — which means a fast FCP — the first piece of DOM content should take at most 1.8 seconds to load. Once it goes above that, it can go to either moderate or slow.
The reason FCP is important goes back to understanding the user. As mentioned before, users are impatient and will leave your website if it takes too long to load. A fast FCP keeps users engaged. It can be something as simple as a loading screen that tells the user to hang in tight because the web page is going to load soon.
One factor that can affect your website’s FCP time is fonts. Fonts can take a long time to load, sometimes making the text invisible until it loads. A good way to solve this is by using the CSS property font-display: swap; when declaring your font using @font-face. For example:
@font-face { font-family: 'MyFont'; font-style: normal; font-weight: 400; src: url(MyFont.woff); font-display: swap; } If you’re using Google Fonts, this property is now enabled by default. This property allows the text to appear using the user’s system default font until the website’s font is loaded.
Another factor that affects your FCP is render-blocking resources. These are usually JavaScript or CSS files that are loaded synchronously in the <head> and take a long time to load. These resources will force the rest of the page to wait until they’re loaded before the page can fully load, thus affecting the FCP of DOM content.
Here are some ways you can resolve this:
-
Add the
deferorasyncattributes to your<script>tags. For example:<script src="myScript.js" defer></script> -
Minify the JavaScript and CSS files being used on the page, reducing its size so that loading these assets doesn’t take as long. This depends on what framework or programming language you’re using, but almost all of them have a way of doing that. You can check out simple tips on how to minify JavaScript when using various popular frameworks on the web.dev site.
-
Remove unused CSS in your web page. As the amount of CSS grows in size, reducing your CSS files by removing unnecessary rules and properties that aren’t being used on a page can make it load faster. Again, there are different ways to do that based on the framework you’re using. However, you can use Chrome’s developer tools to view unused CSS in the Coverage tab. Using frameworks like Tailwind CSS — which use the tree-shaking mechanism to reduce your CSS styles instead of inflating your website with many styles you’ll probably never use — can help in making your website load faster.
-
Reduce the server’s response time. This can be done either by performing the logic required for the page to load using asynchronous requests, caching the data the server is frequently using, or optimizing your server code to get the required result faster.
When you perform the Performance audit, if your web page has an issue with the fonts, the content-blocking resources, unused CSS, or other of the issues mentioned above, Lighthouse will highlight each file causing the issue and give tips on how it can be improved. For example, if a font is blocking the text’s visibility, Lighthouse will show you the font file that’s causing the issue and how resolving the issue will make the page’s FCP time faster.
Here’s an example from the GitHub audit report that shows a CSS file as a “render-blocking resource”.
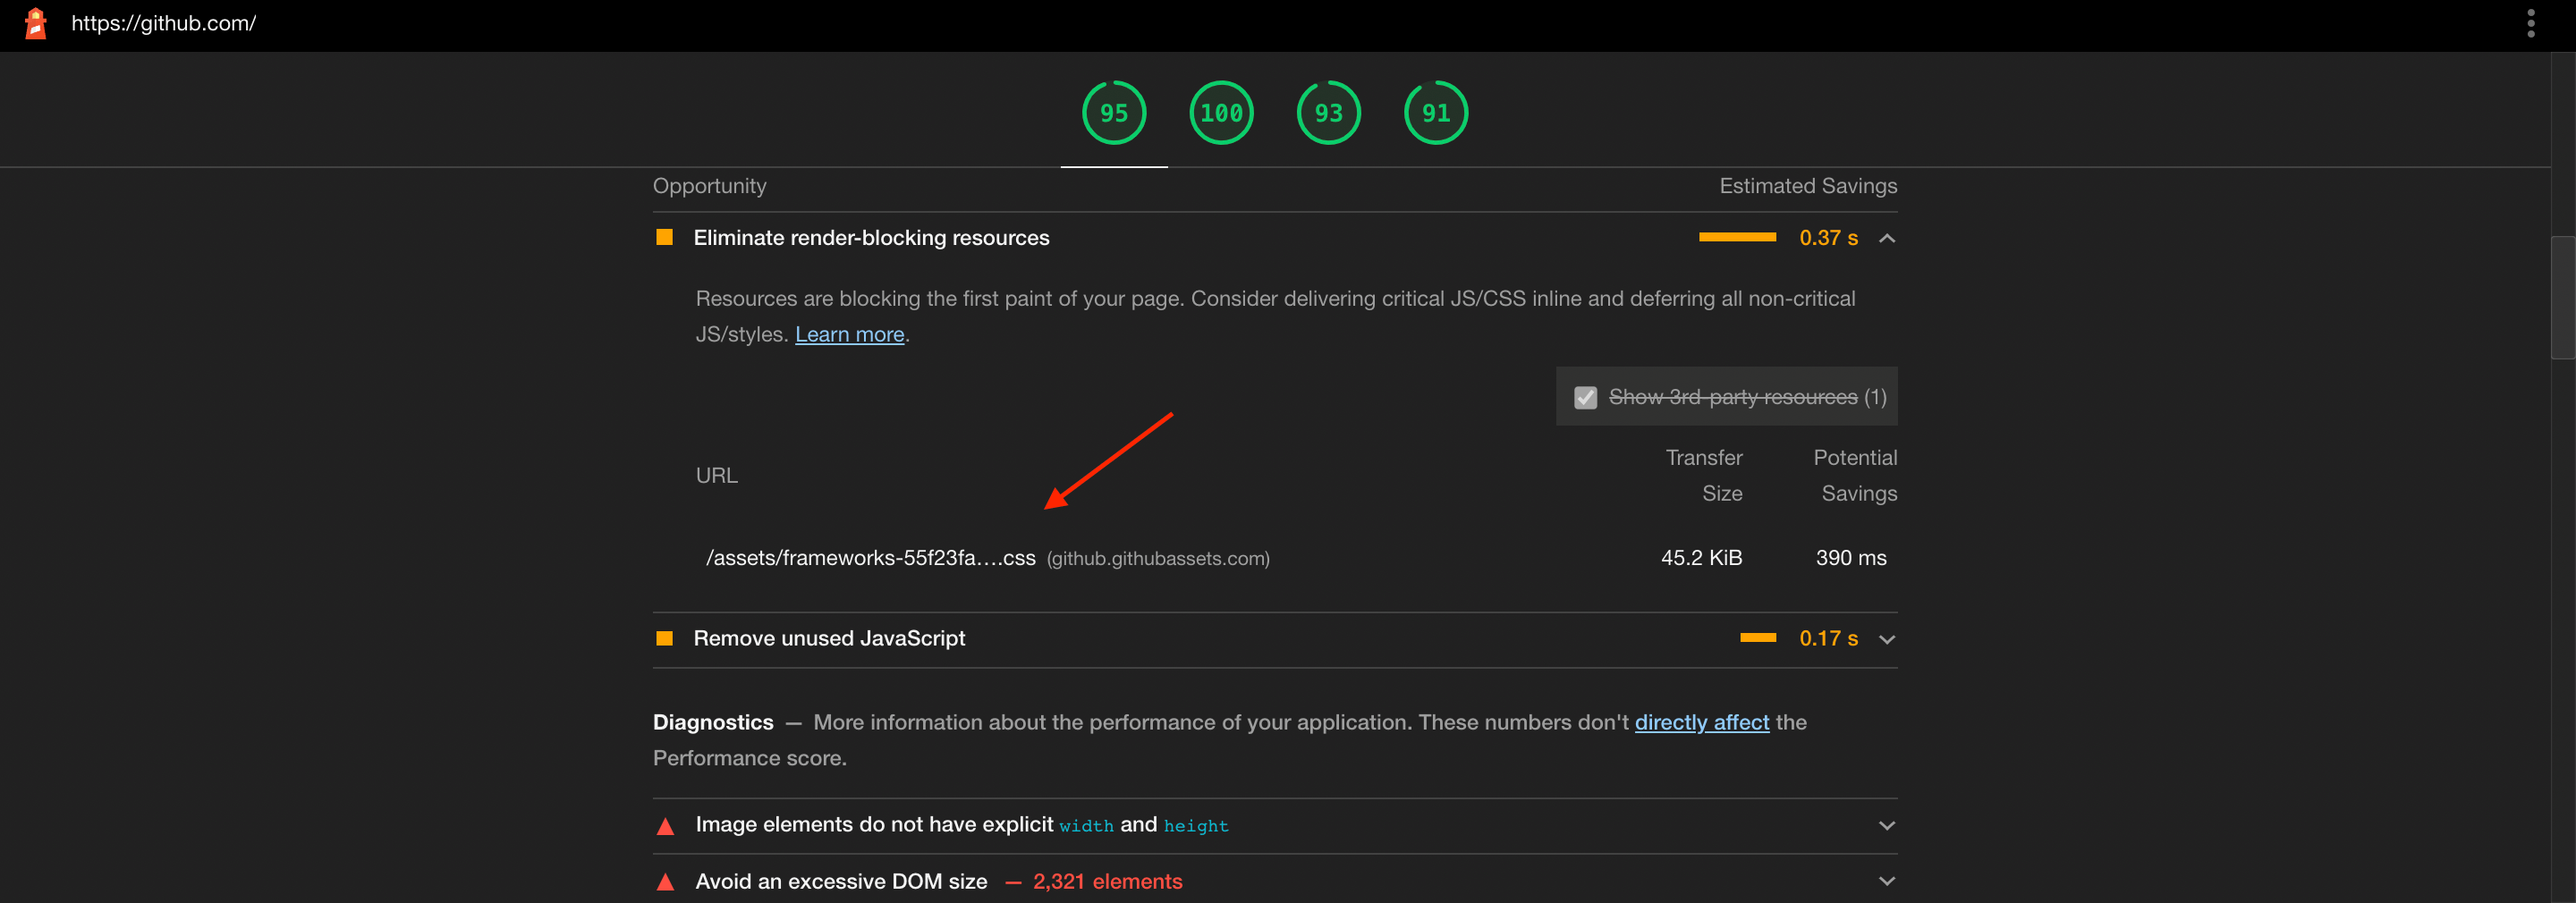
As you read the rest of the metrics, you’ll realize that they somehow depend on the result of this one. So, it’s important to have a good score in FCP.
Time to Interactive (TTI)
Time to interactive (TTI) measures how long it takes for your user to be able to fully interact with the web page. The result of TTI depends on FCP, as the faster the FCP, the faster the user can interact with the web page.
Users not only need to see the page loaded, but they also need to be able to interact with it. It even becomes more annoying if the website seems fully loaded but the user can’t interact with it properly. For example, clicking a button doesn’t do anything, even though it looks ready to use on screen. Improving your website’s TTI will make it easier for your users to use your website, which can result in a better conversion rate.
In order for a web page to be considered fully active, it first needs to achieve FCP. Then, event handlers should be registered for those elements on the page that are visible. And finally, the page should be able to respond to a user’s interactions within 50ms.
A web page’s TTI is measured in seconds. For a web page to have a good TTI, it should take at most 3.8 seconds to become fully interactive. If the page takes longer than that, it will either be considered moderate or slow.
There are several factors that affect a web page’s TTI score. The most common are “main thread work” and “JavaScript execution time”.
Main thread work means the process it takes for the browser to render a page. For the browser to render a page, it first parses the HTML, then builds the DOM, parses the CSS, and executes the JavaScript. If this process takes too long, it means it will also take long for the page to be ready to respond to the user’s interactions, as processing events is also a part of the main thread work.
JavaScript execution time includes the time it takes to fetch the script, parse it, compile it, execute it, and the memory it might use. If fetching the script takes a long time due to its size, it will take a longer time to be able to parse and execute it. After the script is fetched, parsing and compiling it occurs in the main thread work, so if it takes a long time, it will slow down the main thread work. If the script has a lot of code to be executed on page load, which occurs on the main thread work, it will take a long time for the web page to be ready for the user’s interaction.
Improving the TTI metric is very similar to FCP, as it relies on it first and foremost. Good practices would be to minify JavaScript and CSS files and remove any unused code in them. An additional thing you can do is to split the JavaScript and CSS files into bundles (typically done with a bundler, such as webpack). This means that the web page can fetch the bundles faster, and if you’re also using the defer attribute, as detailed in the previous section, it will fetch the bundles even faster asynchronously.
Total Blocking Time (TBT)
This one is pretty similar in concept to TTI. Total blocking time (TBT) measures the total time between FCP and TTI, during which various tasks block user interaction. If an individual task takes longer than 50ms, then it’s considered blocking, and the time after that point is added to the total blocking time. For example, if a particular task takes 90ms, 40ms (that is, 90ms – 50ms) is added to the TBT overall measurement .
This metric basically emphasizes what TTI measures, with extra focus on which tasks are affecting the load time of your page, and how much are they affecting it.
TBT is measured in milliseconds. To get a good TBT score, the total blocking time of tasks on your web page should not be more than 200ms.
To improve your TBT score, it’s similar to TTI. You need to minimize main thread work and reduce JavaScript execution. However, as TBT looks more into the details of the code execution, additional enhancements could be optimizing your JavaScript code so that it works faster. For example, when selecting an element from the document, be specific in your selector rather than using a generic selector like div. Take a deeper look into your code, and look for any chance to improve your code, which will in turn optimize the time each task takes.
Continue reading A Beginner’s Guide to Lighthouse on SitePoint.

